With over 905 billion in online sales in 2022, it’s clear that eCommerce is the new norm. If you’ve launched a website for your store, you’re already on the right track. However, finding the right eCommerce strategies for your business can be tricky, and it can be challenging to secure a steady flow of customers.
Fortunately, when you leverage information gained from eCommerce analytics, you can refine your strategy to maximize your profits. You can learn a lot from just a few simple data points, from tracking cart abandonment to successful conversions.
In this guide, we’ll introduce you to the basics of eCommerce analytics. Then, we’ll share eight key metrics to track and show you a few of the best tools for the job. Let’s dive right in!
An Introduction to eCommerce Analytics (And The Benefits of Tracking Them)
In a nutshell, ‘analytics’ involves collecting and then assessing data for a specific purpose. Typically, this is done using advanced online software. However, some metrics can be determined by completing simple calculations.
When it comes to eCommerce, the goal is to use insights gained from this data to continuously improve your marketing and sales strategies. Here are a few potential benefits you can gain when tracking eCommerce analytics:
- Better understand your audience
- Improve the User Experience (UX)
- Increase customer loyalty
- Refine marketing tactics
- Boost conversions and sales
In order to meet certain goals, online companies usually decide on a specific set of metrics to track. Each one can illuminate something different about customer behavior, web page performance, sales, and more.
8 Key eCommerce Analytics Metrics to Follow
Now that you know a bit about the benefits of tracking eCommerce analytics, we’re going to introduce you to eight key metrics you can follow!
1. Customer Acquisition Cost (CAC)
Customer Acquisition Cost (CAC) is one of the simplest metrics you can track. Yet it’s highly useful.
As the name suggests, CAC tells you how much it costs to land a new customer. It’s fairly simple to calculate this metric, as long as you know how much you’re spending on marketing and how many new customers you earn.
For example, you can start with your monthly marketing budget and divide that number by how many new customers you attract each month. This will give you your CAC.
You’ll want to keep your customer acquisition cost as low as possible, in order to optimize your business model. It’s a good idea to check this metric periodically to ensure that it’s staying at a sustainable rate.
2. Sales Conversion Rates
One of the most important eCommerce metrics you can track is your sales conversion rates. You can calculate this by taking your total number of sales conversions, and dividing it by the amount of visitors who had the opportunity to complete that conversion.
Here’s an example. Let’s say you’re tracking the sales of a new product. Within the first month, you find that 100 people viewed the product page. There were also 30 sales for that specific item. This would make your sales conversion rate 30 percent.
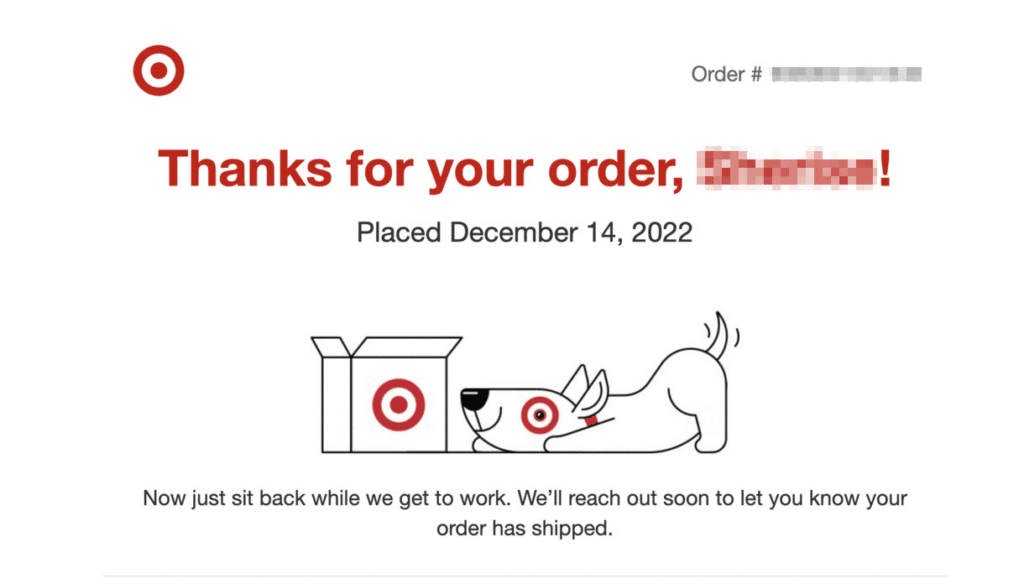
One common way eCommerce software keeps tabs on sales is by automatically inserting tracking code in confirmation or thank you pages:
While sales are perhaps the most significant conversion metric to follow, there are certainly others. For instance, you can track how many people are signing up for your newsletter, downloading a free digital product, or even joining your loyalty program.
3. Cart Abandonment
Cart abandonment is one of the biggest issues in nearly every online industry. From fashion to car rentals, shoppers often leave items in their carts repurchased.
There are many reasons for cart abandonment, but high shipping costs and a lengthy checkout process are at the top of the list. Furthermore, cart abandonment is especially common among mobile users.
If you track this metric and discover it’s an issue in your online store, you can make an effort to reduce cart abandoment. You might try some of the following tactics:
- Offer free shipping
- Redesign your checkout page
- Implement one-click checkout
If you can optimize the checkout process so it has a straightforward design and minimal requirements, you’re likely to land more sales.
4. Average Order Value (AOV)
Average order vale (AOV) illustrates the average dollar amount that users are spending on each order. Again, you can calculate this using simple division. You’ll need to know your total profit and your total number of orders.
Ideally, you’ll want your AOV to be as high as possible. However, it’s not uncommon for users to buy just a few products, especially if they are new to your store.
If your shop has a low AOV, here are some strategies you can use to encourage larger orders:
- Implement upselling/cross-selling
- Offer free shipping on large orders
- Provide discounts
Upselling and cross-selling can be particularly effective ways to increase your AOV. You can do this by advertising similar, complementary, or superior items on your product pages:
These are typically displayed in sidebars or at the bottom of the page, under a heading like “Complete the Look” or “Frequently Bought Together.” If you’d like to try out this tactic in your WordPress store, you can use a plugin like WPC Frequently Bought Together for WooCommerce.
5. Repeat Customers
Repeat customers are shoppers who return to your store for additional purchases. This is another key metric to follow.
You’ll want to encourage repeat buyers as much as possible. However, with so much competition, it can be difficult to retain eCommerce customers.
One great way to gain repeat purchases is with a loyalty program:
You’ll want to provide users with significant rewards. This way, they are incentivized to come back time and time again.
6. Bounce Rate and Time On Page
It’s crucial to know how users are interacting with your website and its individual pages. Therefore, two of the most useful metrics you can track are bounce rate and time on page. ‘Bounce rate’ is the number of users who land on your website and leave without clicking through to another page on your site.
Meanwhile, ‘time on page’ refers to how long users are spending on your web pages. When you first launch an eCommerce site, it’s not uncommon to have a high bounce rate and low time on page, but you’ll want to make every effort to combat this.
Improving page loading times and overall site performance is key when it comes to reducing your bounce rate. Additionally, prioritizing the user experience is vital to increase time on page.
Here are some other tactics you can try to improve both of these metrics:
- Improve your internal linking
- Install a plugin that targets website performance
- Enhance your navigation menus
- Add a search bar on every page
Each of these strategies will make it easier for users to navigate around your site seamlessly.
7. Click-Through Rate (CTR)
In Pay Per Click (PPC) marketing, you can pay to have your advertisements featured on certain pages. With Search Engine Marketing (SEM), you can pay or ‘bid’ on certain search terms. Depending on your bid, the relevancy of your content, and your page’s overall quality, your content can get boosted to the top of relevant search results.
Meanwhile, organic search results display web pages based on algorithms designed to provide users with the most relevant content – no payment required:
In all of these scenarios, Click-Through Rate (CTR) refers to the percentage of ‘impressions’ (or views) that result in a click. Therefore, you’ll want your CTR to be as high as possible.
With both classic PPC advertising and organic marketing, you can improve your CTRs by creating concise headlines and useful meta descriptions. It’s also smart to do some keyword research so you can target terms your audience is already looking for.
8. Audience Demographics
Last but not least, audience demographics can be extremely helpful when it comes to eCommerce analytics. Here are some data points you may want to track:
- Type of device
- Location
- Age
- Income level
You can use sign-up forms to collect some of this information from new users. Alternatively, you can create a survey to learn more about pre-existing customers.
This data can help you better understand your target audience. This way, you can shape your content marketing strategies, prices, and page designs around their specific needs.
How to Track eCommerce Analytics
Now that you’re familiar with some of the most important eCommerce metrics, you’ll need to know how to track them. As we mentioned earlier, you can calculate some eCommerce analytics metrics manually. However, this can be tedious and time-consuming.
Fortunately, there are plenty of analytical and marketing tools that can automatically track and calculate many eCommerce metrics for you. You’ll want to thoroughly research them to determine which is best for your business.
If you’re not sure where to start, Semrush and Google Analytics are two of the most popular and reliable tools you can use:
Both are user-friendly and straightforward. Plus, they both integrate seamlessly with WordPress.
Conclusion
As eCommerce becomes increasingly popular, it may be difficult for your online store to stand out in the crowd. By leveraging eCommerce analytics, you’ll be better prepared to serve your customers and increase sales.
You can get started by tracking simple eCommerce metrics like your customer acquisition costs, sales conversion rates, and average order values. Then, you can use a tool such as Google Analytics or Semrush to assess website and ad performance metrics like bounce rates and click-through rates.
Do you have any questions about getting started with an eCommerce analytics strategy? Let us know in the comments section below!


