
Use New Relic with WPMU DEV hosting to identify and quickly tackle any performance issues on your WordPress site.
New Relic is a service that hones in on performance and availability monitoring for WordPress. And one of the best perks about it is — it’s free!
With New Relic, you can immediately comprehend application performance and get a complete overview of your operating environment. It’s all very understandable from a single screen — making it perfect for you and your clients.
Combined with WPMU DEV’s fully dedicated hosting, it’s a winning formula for complete Application Performance Monitoring (APM) across all spectrums of your WordPress site!
This article will have an overview of New Relic and how it incorporates with WPMU DEV hosting.
We’ll cover:
- What New Relic Does and a Brief Overview
- Quick Look at Identifying Performance Issues on Your WordPress Site
- Installing New Relic with WPMU DEV Hosting
By the time you read this, you’ll see how New Relic and WPMU DEV can immediately benefit you and your WordPress business by monitoring and tackling any potential issues.
What New Relic Does and a Brief Overview
As I touched on, New Relic helps identify issues with your WordPress’s performance and get a nice glimpse of how smooth everything is operating.

In a nutshell, it’s made for Full-Stack Observability, which means it gives you the insight of knowing what’s happening in your digital system, plus why. It’s the entire picture that lets you enable your applications and devices to deliver value to your customers.
This makes it simple, so you don’t have to rack your brain trying to understand your system. New Relic takes the complexity out of it (yippee!).
For the Basic User (free version), you have access to many features, including making custom charts, creating custom dashboards, automatic anomaly detection, running data queries, and enabling alerts.
The free version is excellent in many (or most) circumstances; however, you can always upgrade to activate the additional features. Check out this comparison between free and paid versions to get an idea of what works best for you.
Brief Overview of New Relic APM
We’ll take a look at some of the best features in New Relic APM. This is a quick walk-through of some assets of what’s included and what it can do. Then, we’ll take a look at how to install it with WPMU DEV’s hosting.
There’s a lot to New Relic, so these are just some of the highlights:
Let’s check them out in more detail!
The Summary is made to provide you a 360-degree view of your WordPress site’s performance.
Here, you can view Transaction Types between Web (e.g. StatusCode) and Non-Web (PHP). You’ll see data for Response Time, Memcached, and MySQL.

Plus, the number of requests per minute is shown in the Throughput chart.

Any errors appear in the Error Rate data. This indicates the ratio of errors to the total number of requests your site processes.

There’s more in the Summary section, such as Apdex Score, Transactions, and Hosts.
The Summary is a great place to get an initial glimpse of your website’s performance and issues.
Service Maps are customizable visual representations of your WordPress site’s architecture. The maps show your app’s connections, plus dependencies. This includes applications, hosts, servers, databases, and more.
They can be accessed via the Explorer tab/Service Map.

These maps help you understand how apps and services in your architecture communicate and connect. Also, you can easily see the operational state of your environment.
If you see issues, you can troubleshoot and see what troubles it’s wreaking havoc on down the line with all of your connections.
For more on Service Maps, be sure to check out New Relic’s documentation.
With Transactions, you can look in-depth at your Top 5 web transactions, monitoring your web requests. Transactions are defined as one logical unit of work in a software application.
The two foremost transactions that are included are Web and Non-Web. There are also sub-types (e.g. C SDK, Java, and .NET) that can be viewed.
You’re able to code bottlenecks and more that make your site grind to a halt in the Transaction Traces area.

Customize this area by setting up custom instrumentation, so you can report additional transactions if you’d like.
More information about Transactions can be found here.
The WordPress Plugins and Themes tab display how much PHP processing time the active themes and plugins are using. You monitor if a plugin or theme is consuming ample time and then handle the issue accordingly.
Sort from the dropdown:
- Most time consuming
- Slowest average call time
- Function call count

There are numerous reasons for a plugin or theme to run a high processing time, everything from needing an update, bad installation, and more. It’s essential to investigate thoroughly before simply removing a plugin or theme, taking the most time.
There’s a lot to observe from the Databases tab. This area will enable you to identify the database tables and queries that take up the most time. It displays an application’s database and cache data.

If any slow queries have been reported, they will be displayed when you select a transaction.
This area has three separate parts:
- All-databases overview
- Top database operations
- Table with all database operations
Filter operations by database vendor, review top database operations, and delete traces.
With the External Services, you can easily view which external services are consuming an abundance of time. With this information, you can determine if the issue is speed-related or quantity, then resolve the issue.

In general, WordPress sites rely on several external services, so it’s important to keep tabs on any issues that occur from any of them.
And There’s More…
Keep in mind that there’s a LOT more to New Relic, including Events, Errors, Alert Conditions… The list goes on and on. Be sure to check out all New Relic features on their website. Or better yet, install it for yourself!
Quick Look at Identifying Performance Issues on Your WordPress Site
There are many ways to identify and take care of performance issues on your WordPress site with New Relic, as I touched on with its overview. Let’s take a look at an example.
For this instance, let’s say you’re checking out how your client’s plugins are performing.
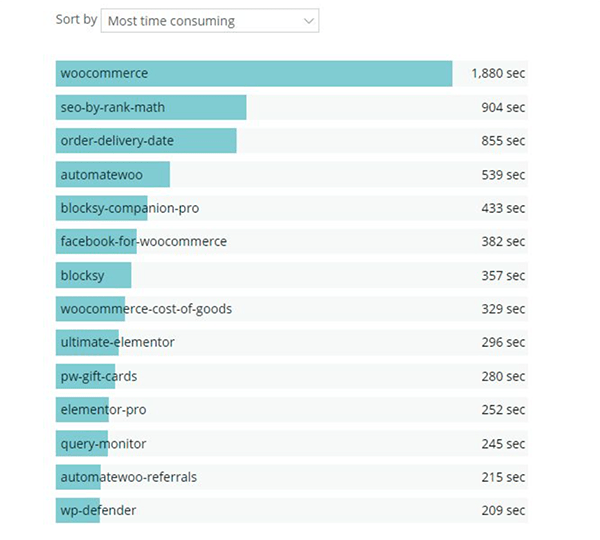
As you can see, WooCommerce is taking up the most time in this WordPress ecosystem, followed by RankMath. Then, it’s followed by a lot of addons for WooCommerce.
Consider the options of removing any of these plugins. What plugins are essential? Any that aren’t? Is there anything you can do to help your client’s WordPress site’s performance by removing a plugin? Hmm…
In this case, Query Monitor is running. And it makes sense to disable it.
There’s a big difference between running system-layer benchmarks (e.g. New Relic) and running an application layer, like Query Monitor.
Query Monitor monitors and hooks all calls while WordPress is trying to execute them, so it can add more load time overall since you have to wait for its logging mechanisms to go to work.
Basically, it doesn’t need to be constantly used; therefore, it’s best to disable it.
New Relic features some more examples of identifying and handling performance issues on their blog. It’s worth checking out for another look at how the New Relic system works.
Installing New Relic with WPMU DEV Hosting
Now that you got your feet wet with what all New Relic has to offer, and a glimpse at how to identify and take care of performance issues, here’s how you can quickly and easily get it synced with a hosted site from The Hub.
Keep in mind that you need to host your site with us to use The Hub feature with New Relic. If you’re not hosting with us yet, check out our hosting plans and give us a spin. We have a 30-day money-back guarantee if, for any reason, you’re not happy with our hosting.
Set Up a Free New Relic Account
To get a free New Relic account, you don’t need a credit card or any means of payment put in their system. It’s entirely free unless you want to upgrade at some point.
If you haven’t already, simply head to their website, and sign up for a free account with your Name and Email.

Once you input your information, you’ll get a notification email, and you can set up a password. That’s it!
We’ll now hop into WPMU DEV’s The Hub and start the process from there, then get back into our New Relic account.
Connect a Site to New Relic From The Hub
Since you’re all set up with a New Relic account, connecting to a website that you have hosted in The Hub is a snap.
First off, go to the site that you want to connect to. The quickest way to access your hosted sites is to click the Hosting tab in the dashboard. That will immediately bring them all up.

On the site you want to include New Relic on, the green cloud icon will get you to where we need to go.

That will take you to a new dashboard, where you will click on the Tools button.

Once clicking on that, scrolling down will get you to the New Relic Monitoring area. If you don’t have New Relic connected, it will indicate that it’s off.

Clicking in the Off area will open up a pop-up where you have options to Enable/Disable New Relic, add a License Key, and give it an App Name that will appear in New Relic once connected.

So, how do we go about getting the key? Leave this option open, and we’ll head back into New Relic in a new tab.
Getting the License Key
When logged into your New Relic account, obtaining a license key to add into The Hub and sync your account is just a couple of steps.
Simply go to your icon button in New Relic, that’s located in the upper right corner. When you click on it, it’ll bring up a dropdown that includes API Keys.

Clicking on API Keys displays all of your API keys. From here, you want to click on one that says LICENSE in it, tap on the ellipsis, and select Copy Key.

Got the key copied? Great! Let’s move on to…
Activating New Relic in The Hub
The screen that we previously were on (Hosting> Tools> New Relic Monitoring) should be there waiting for you (unless, of course, you closed out that tab).
Simply paste the code where it says License Key and, if you haven’t already, give it a name. Once pasted, you’ll switch the Enable/Disable ON (it’ll turn blue) and click Save.

And now, you’re ready to…
See Your Data in New Relic
It doesn’t take long for data to start being collected in New Relic and appear on a lot of what we covered already (e.g. Transactions).
The App Name that you gave your website should appear in New Relic almost instantly! Go to the Explorer tab and click on APM. Your new account should appear, along with any existing accounts that you already have set up.

New Relic will take it from here, letting you know of any performance issues so that you can stay on top of them with ease! They even have mobile app options for Android and iOS.
Out with the Old, In with the New Relic
The old way of looking at your WordPress’s performance, identifying and taking care of any issues is better than ever. Thanks to New Relic and its easy-to-understand platform, it’s not tough to do.
As you can see, it’s painless and easy to set up, implement, and take advantage of today.
To implement all that we covered in The Hub, be sure to check out our fully dedicated hosting if you’re not hosting sites with us currently.
Enjoy your NEW way of WordPress performance monitoring with New Relic.


